%201.svg)





What Is Average Inventory?

Average inventory is a formula businesses use to calculate the estimated value or quantity of items held in inventory over two or more specified time periods, rather than showing the value of on-hand inventory as a snapshot in time.
It’s good to know how to calculate average inventory because it gives you the average value, providing a broader, more representative view of inventory levels over time. And having this information makes it a particularly useful metric for understanding how to improve your inventory management, as it can support better decisions on operational efficiency, cash flow management, and financial metrics such as inventory turnover.
So, since it’s so important, here’s how to calculate average inventory using the formula.
The Average Inventory Formula
.jpg)
Here’s how to calculate average inventory expressed as a formula:
Average Inventory = (Beginning Inventory + Ending Inventory) ÷ Number of Periods
To learn how to calculate average inventory, you'll start by taking the value of goods at the start of the period you want to analyze, and add that to the value of goods at the end of that same period (this period can be days, months, or quarters).
For example, let’s say your company had $50,000 worth of items stocked at the beginning of January and $70,000 by the end of January. Using the formula above, here’s how to calculate average inventory in this scenario:
($50,000 + $70,000) ÷ 2 = $60,000
So, the average inventory for January was $60,000.
But what happens if you want to compare multiple periods to figure out your average inventory value over a longer time frame? If you have more than two data points available (in the above example, we were dealing with 2, the beginning and the end of January), then you divide your beginning and ending inventory values by the number of data points.
Let’s clear this up with a new example.
So, in January, the month ended, and we had $70,000 in current warehouse inventory. But, let’s say we want to look at the three previous months:
- December — $50,000
- November — $14,000
- October — $37,000
In this instance, we’ll add all the months together and divide by the number of data points (four, since we’re looking at October, November, December, and January). Here’s how to calculate average inventory in this scenario:
($37,000 + $14,000 + $50,000 + $70,000) ÷ 4 = $42,750
So, the average inventory over the four months was $42,750.
What About Average Inventory Period?
In your quest to better gauge how effectively you're managing your inventory, you’ve likely stumbled across the average inventory period, too.
Most times when it comes to talking about industry definitions and terms, although some tend to differ, they’re almost always used interchangeably — with the exception of this. The average inventory period is a formula for calculating just how many days on average it takes for a company to replace its inventory, and it looks like this:
Inventory Period = Number of Days in Period ÷ Inventory Turnover
Most companies that make this calculation do so over a 365-day period, but the timeline can be shorter than one year and may be useful for analyzing liquidity (which is important for a company experiencing financial difficulties). But to calculate your average inventory period, you first need to calculate inventory turnover, which can be done using the following formula:
Inventory Turnover = COGS ÷ Average Inventory
So, back to the examples to illustrate how to measure your inventory turnover.
Let’s imagine your company's COGS in 2025 was $90 million. During this period, the ending inventory balances for 2024 and 2025 were $16 million and $24 million, respectively. Using the average inventory formula, your average inventory value over the two years was:
($16 million + $24 million) ÷ 2 = $20 million
So, now that we know the average inventory value was $20 million, we can start calculating the average inventory period. To do this, we’ll need to divide the COGS by the average inventory value:
$90 million ÷ $20 million = 4.5x
So, in 2025, this company cycled through its inventory 4.5 times. With the inventory turnover rate calculated, we can determine how many days it took to sell inventory in 2025 by dividing the days in that year by the turnover rate:
365 ÷ 4.5 = 81 days
And there we have it! According to the average inventory period, this company takes 81 days to replenish its inventory. But, we wanted to take that detour to clear up any potential confusion with the formulas and their names. Now that’s all crystal clear, let’s get back to understanding everything around how to calculate average inventory.
Why Is Knowing How to Calculate Average Inventory Important?

You’ll want to know your average inventory value because it will help you understand your true value, since single-day stock fluctuations can otherwise be misleading
The average inventory value negates that to give you your business’s:
- True holding costs
- Working capital needs
- Operational efficiency
With this information to hand, you can begin making better restocking decisions, allocating cash where it's needed most, and clearing out your warehouse to identify the items that are shrinking profit margins.
But here are five more reasons it’s important to understand how to calculate average inventory levels:
1. Measures Turnover Efficiency
The formula essentially serves as the foundation for calculating your inventory turnover ratio (which we covered in the previous section) and helps you better understand how quickly your company sells its finished goods. Your inventory turnover rate will help you improve your inventory management by showing exactly how much inventory is needed to meet demand and when to replenish stock.
2. Improves Cash Flow Management
Spending on inventory that doesn't sell ties up cash that could otherwise support other parts of the business.
The better a company understands its average turnover, the more effectively it can manage both income and spending, including identifying its ideal economic order quantity (EOQ) — the point that balances maximum profitability against minimum inventory costs.
3. Smooths Volatility and Reveals Trends
Averaging cancels out spikes from seasonal rushes or unexpected supply chain delays that a single end-of-period count would misrepresent.
Calculating averages across multiple time periods (monthly, quarterly, or yearly) surfaces both short- and long-term trends, giving businesses a clearer read on customer demand and a stronger foundation for financial modeling and purchasing strategies that keep high-demand items in stock.
4. Optimizes Storage and Prevents Stock Imbalances
Tracking whether average inventory values are rising, falling, or holding steady helps a business right-size its storage footprint — freeing up warehouse space when levels decline, or signaling the need for more space when they climb.
This same visibility helps strike a balance between overstocking, which wastes money on storage, and understocking, which risks running out of product.
5. Supports Customer Satisfaction
Maintaining the right level of inventory enables a business to fulfill orders faster, keeping customers satisfied and encouraging repeat business.
The 7 Limitations of Average Inventory

Average inventory is a useful metric, but it comes with several drawbacks that can obscure important operational and financial realities if left unaddressed.
1. Hides High Volatility
Smoothing inventory data over a period can erase evidence of significant stockouts or overstock surges that occurred within that window.
Common practice calculates average inventory using month-end balances, but the result can look very different from what you'd get using day-end balances, since the month-end snapshot may miss volatility that occurred mid-period.
2. Skews Results During Seasonal Cycles
When a company generates a significant portion of its sales during a specific season, inventory balances (and the resulting average) become skewed.
Balances typically run abnormally high just before a seasonal sales spike and abnormally low immediately afterward, which can distort year-to-date trend calculations and lead to misleading conclusions about typical stock levels.
3. The Quota Factor
Month-end inventory balances may also reflect a push to meet sales quotas, resulting in an artificial drop in reported inventory that falls well below daily norms.
This distortion, layered on top of seasonal effects, can further misrepresent what a company's "typical" inventory position actually looks like.
4. Estimated Balances Introduce Errors
In common practice, month-end inventory values are often estimated rather than physically measured, and estimation errors get carried into (and amplified by) the average inventory calculation.
Because inaccurate ending inventory balances directly affect the cost of goods sold and reported profitability, the financial consequences of these errors can be significant. A clear, well-documented inventory count policy reduces this risk by minimizing ambiguity and simplifying the physical count process.
5. Masks Product-Level Performance
Average inventory assumes that all inventory on hand sells at a roughly even pace throughout the year, but this is rarely true in practice — some items move quickly while others sit for extended periods.
Because the metric produces a single blended figure, it can't distinguish between fast-moving and slow-moving stock, which can lead to inaccurate inventory valuation if this limitation isn't accounted for.
6. Excludes Other Cost Factors
The average inventory formula is based solely on cost of goods sold, which means it doesn't capture other costs associated with holding inventory, including:
- Storage costs
- Manufacturing overhead
- Insurance
- Shrinkage
Leaving these factors out can lead to an underestimation of the true cost of carrying inventory.
7. Doesn't Account for Price Changes
The formula also doesn't adjust for price fluctuations over time.
As prices rise or fall, the accuracy of the resulting inventory valuation shifts accordingly, making it important to track pricing trends and adjust the calculation as needed.
Despite these limitations, average inventory remains a valuable and widely used tool for inventory valuation when its constraints are properly understood. And if you’re looking for a tool that can help you better manage your inventory and improve your average inventory value, then why not check out Digit?
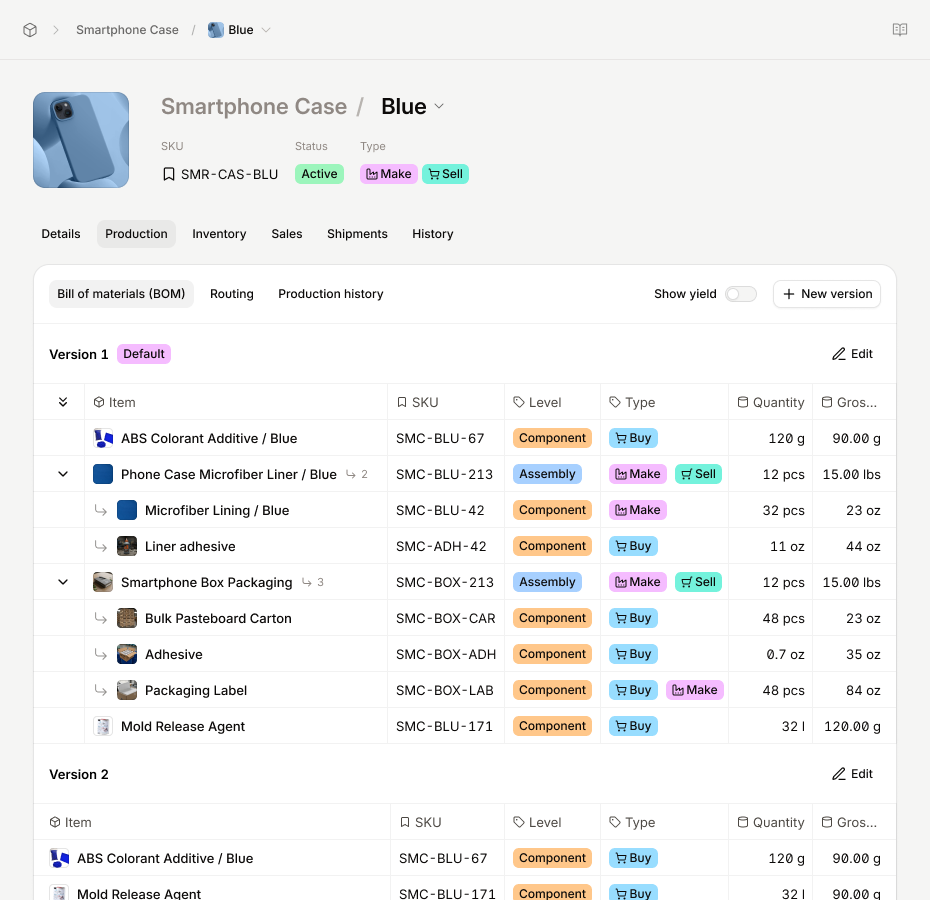
Tracking Average Inventory Automatically with Digit
.jpg)
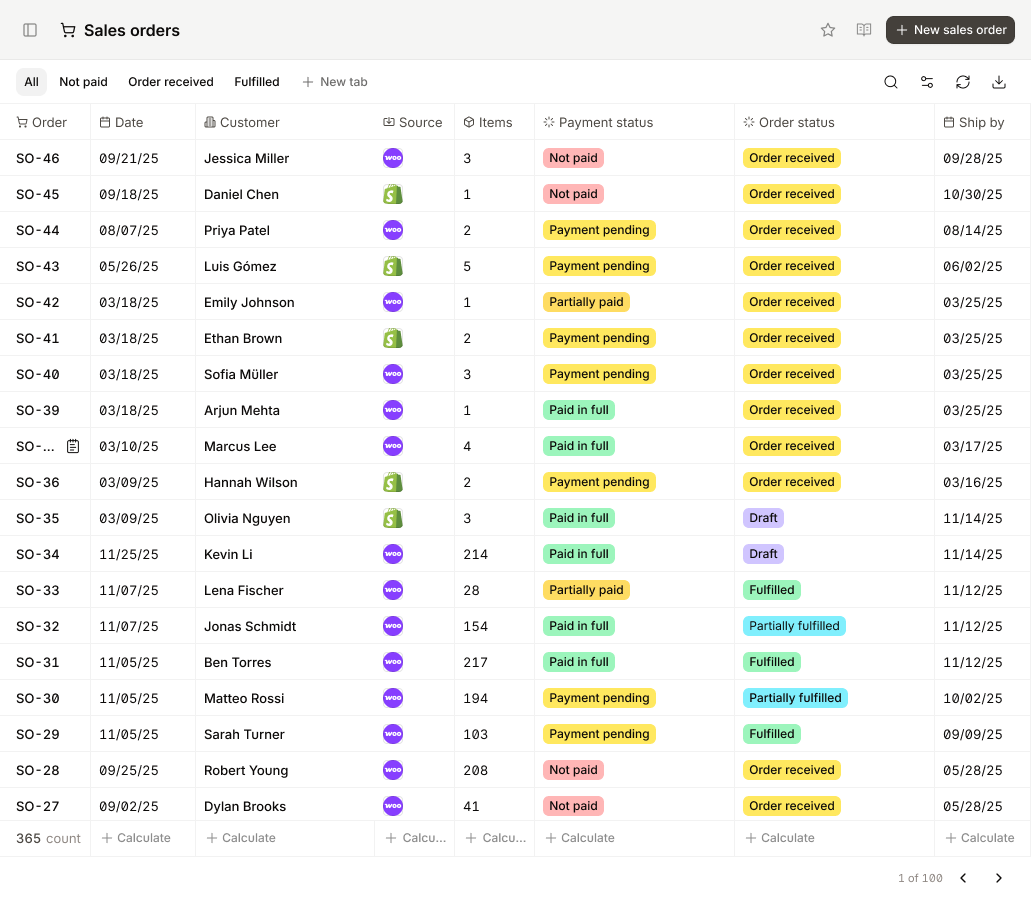
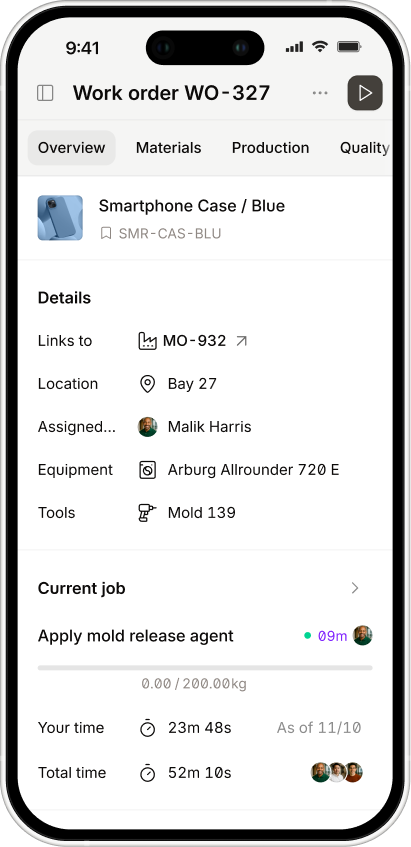
Digit eliminates manual counting by automatically logging stock levels in real time as items are received, manufactured, or shipped.
Acting as a cloud-based central source of truth, Digit maintains accurate on-hand inventory levels, providing the data foundation to dynamically track average inventory and the metrics built on it.
Rather than requiring users to manually calculate averages across spreadsheets, Digit natively records inventory movement data throughout the entire supply chain. Inventory counts adjust automatically as e-commerce orders come in or warehouse actions occur, while standard financial entries sync through Digit's QuickBooks integration, updating stock valuations and historical cost data simultaneously. The platform also monitors stock levels by batch, lot, and warehouse location using FIFO or LIFO rules for full traceability, and it captures real-time Cost of Goods Sold reporting as items are picked, packed, and shipped through sales order management.
Once Digit automates rolling stock logs, that continuous baseline of data feeds directly into the key performance indicators tracked through the system's reporting dashboards.
Average inventory becomes the basis for inventory turnover, showing how many times total stock sells through in a given cycle, and for the same replenishment-cycle metric described earlier in this article as average inventory period — a figure Digit surfaces as Days Sales in Inventory (DSI) by dividing real-time average inventory by COGS and multiplying by the number of days in the period. Digit also applies these historical averages, combined with safety stock parameters, to trigger smart reorder alerts before shortages happen.
Want to see how Digit can help improve your business? Then why not book a demo? We can show you firsthand how it can take your business to the next level.




.jpg)